Data Science Nigeria is Africa’s fastest growing Artificial Intelligence learning, solution delivery, research and consulting network, whose sphere of impact has touched hundreds of thousands in four years.
We are scaling up in 2021 and thus seek well motivated and smart professionals who are willing to join our world of impact.
We value excellence, global best practices and sustainable impact.
Check our vacancies
Rape is a worldwide epidemic which stands on the same pedestal with the offence of murder and has been largely characterized by a culture of impunity. The definition of rape is inconsistent between governmental health organizations, law enforcement, health providers, and legal professions. It has varied historically and culturally. The World Health Organization (WHO) defines rape as a form of sexual assault, while the Centers for Disease Control and Prevention (CDC) term rape a form of sexual violence.
Rape according to Hornby, A.S. (2006)1 is the crime of forcing somebody to have sex with one especially using violence. It is the crime of forcefully having sex with someone against the person's wish (Chiedu, 2012)2. According to Brigneti and Egbonimali (2002)3, rape is an act of sexual violence that involves intercourse without consent or against someone being willing to engage in the act. Itis posited that rape could even happen “Without the use of force” (Ayonrinde, 1984)4. By this, itis meant, that if for instance an adult of any age range tactfully seduces a child of a tender age for either marriage or sex with an enticing gift and the child after collecting same willingly give in for it with the adult, itis said to be rape as well. This form of rape is viewed as “A sex crime carried out by pathological men who were unable to control their own sexual desires”5.
NeurIPS 2020 Meet Up.Data Science Nigeria would be hosting local meetups to stream live and watch pre recorded videos from the 2020 NeurIPS Conference. Register to join us!
In the first part of this article, we learned how to create a twitter developer account, how to download and install Orange3 Text Mining, and how to stream twitter data and do sentiment analysis with Orange3 Text Mining.
Before we start, what is PowerBi in the first place? PowerBi is a business intelligence service by Microsoft that provides users with tools for Aggregation, Analysis, Data-Sharing, and Visualization. There are several possible ways to work with Power BI- Power BI Service(Web), Mobile, Embedded and PowerBi Desktop (Desktop App). Without much ado, let’s get started!
Step 1: Download and Install PowerBi Desktop
Power BI Desktop allows you to ingest, transform, integrate and enrich data by connecting to various data sources. This FREE desktop application simplifies data evaluation and sharing with scalable dashboards, interactive reports, embedded visuals and many more.
To download PowerBi Desktop, all you have to do is:
On the next page, select the checkbox to download the powerbi version that suits your system and click next to download.
pagePowerBi Download
To install it, simply run the downloaded .exe file and follow straightforward installation wizard prompts.
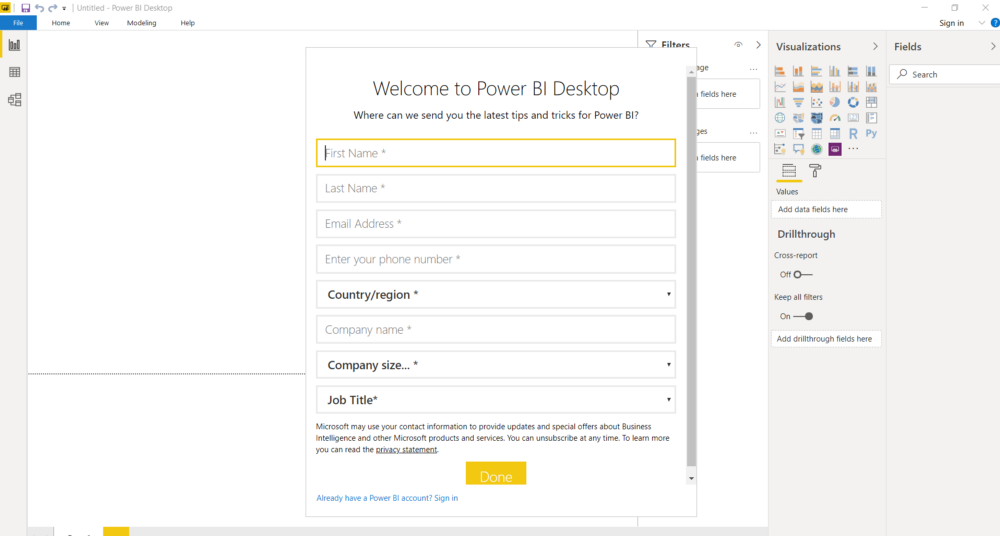
The next step is to sign up for a Powerbi account (if you would like to do so later, you can skip the registration process by clicking ‘Already have a Power BI account? Sign in’ and close the sign-in page.) If you already have an account, just use your credentials. Note: if you have an official email, I will recommend you create the PowerBi account because there are some visuals that we will import from the PowerBi Marketplace; doing this requires having a powerbi account. Now, we are ready to explore.
Step 2: Import Dataset into PowerBi
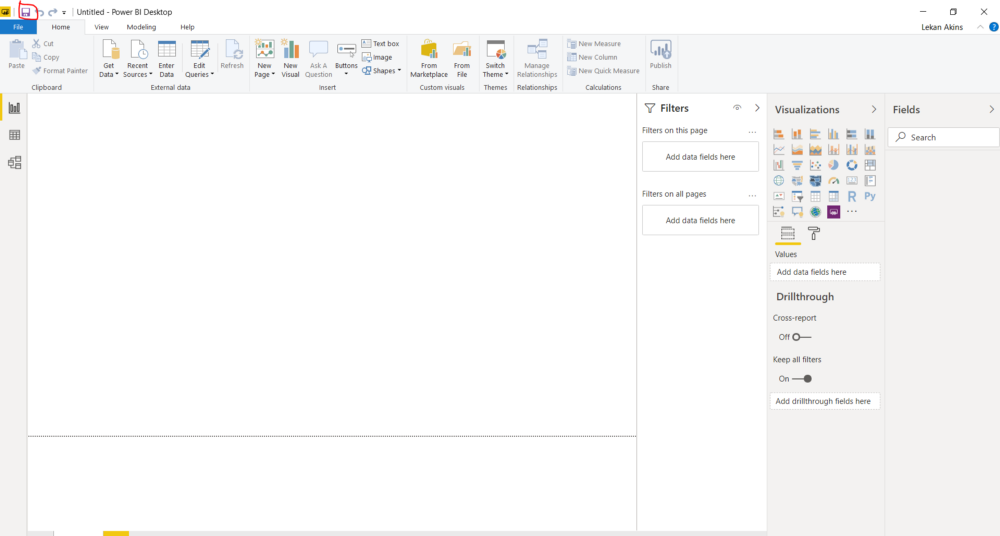
Best Practice: Save the report
As a best practice, you should save your PowerBi report before doing any other thing. To save your report, click the save button on the upper left corner of the page. Now, let’s import our sentiment analysis data ( the .csv file that was exported from the Orange3 Text Mining in the first part of our tutorial. You can download the data by clicking here .)
To build a dashboard, you have to connect to a data source. The following are the steps you need to follow to connect to a data source:
Click on the ‘Get Data’ button.
Select the source type; in this tutorial, we are working with a Text/CSV file
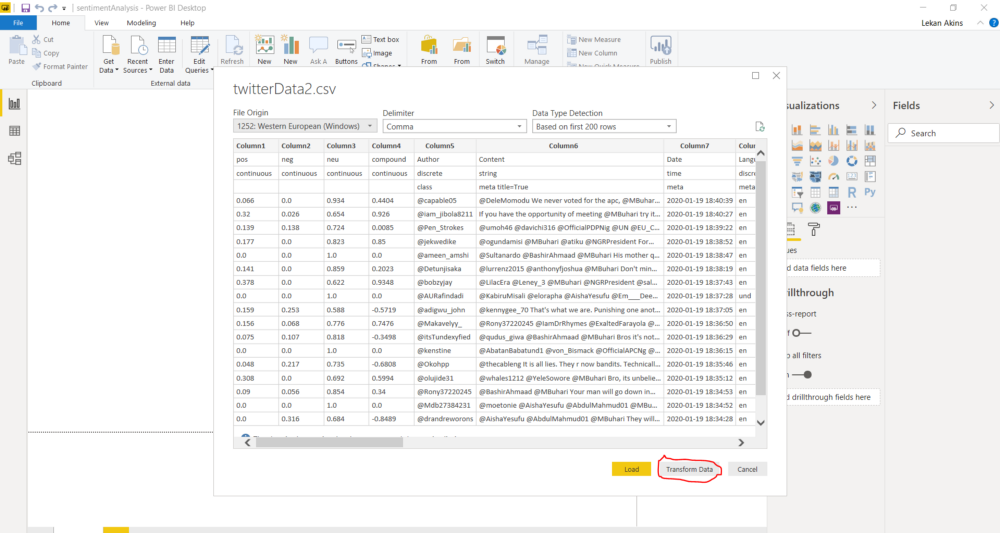
3. Locate the data in the file explorer and select it; once you connect successfully to our data source, you will see the window below:
Click Transform
Step 3: Preparing Data for the Load
Data doesn’t always come clean and prepared. Before loading data into powerbi, it is always good practice to clean the data in Power Query. To prepare data for load, click the ‘Transform Data’ button.
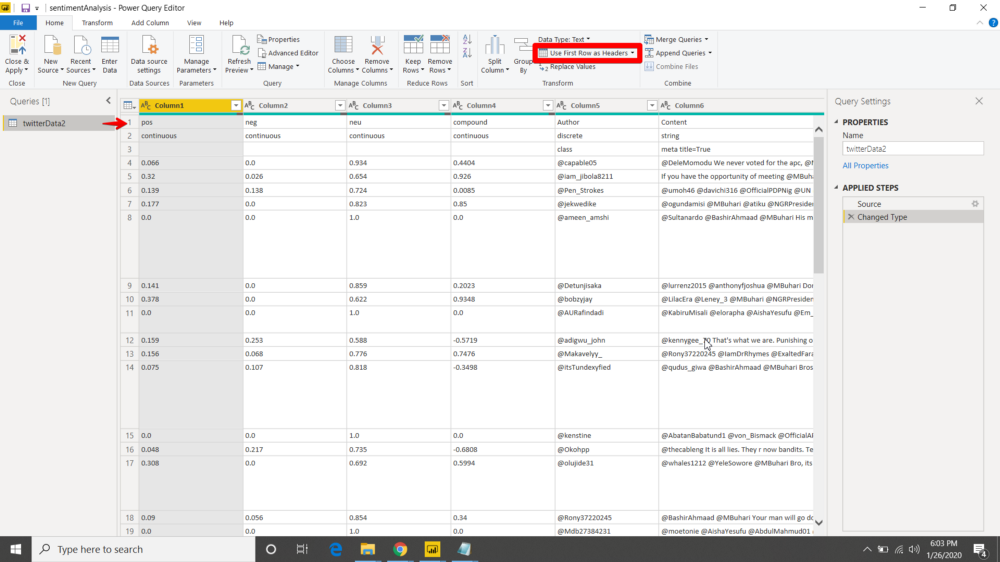
Power Query view
Follow these steps to prepare the data for load:
Use the First row as a header: the first row of our data is good to serve as our data table header. On the Home ribbon, click ‘User first row as headers’.
Remove the first 2 rows: we don’t need the first 2 rows on our data table, so let’s get rid of it. On the Home ribbon, click ‘Remove Row’ and click ‘Remove Top Rows’
Remove Rows
and input 2 in the Remove Top Row dialogue box as shown in the image below:
Remove Top Rows
3. Change Data Type: To change Data Type, click the data type button on the left side of the column name. We need to change some data to their correct data types; the following columns should be changed to Decimal Numbers, ‘pos’,’ neg’,’ neu’, and ‘compound’; the other numeric columns should be changed to the Whole Number. The Date column should be converted to Date/Time.
4. Create a Conditional Column: Let’s create a conditional column called ‘Sentiment’. The Sentiment column will help us identify the Negative, Positive and Neutral sentiments from the ‘Compound’ score. Follow these steps to create the conditional column.
4a. On the Upper ribbon, click ‘Add Column’ and select ‘Conditional Column’
4b. Now input the conditions; if ‘compound’ is less than 0, the sentiment is ‘negative’; if ‘compound’ equals 0, the sentiment is ‘neutral’; if ‘compound’ is greater than 0, the sentiment is ‘positive’. See screenshot below:
5. Load Data: Now that we prepared our data, let’s go ahead and Load. Click the Close & Apply button to load data.
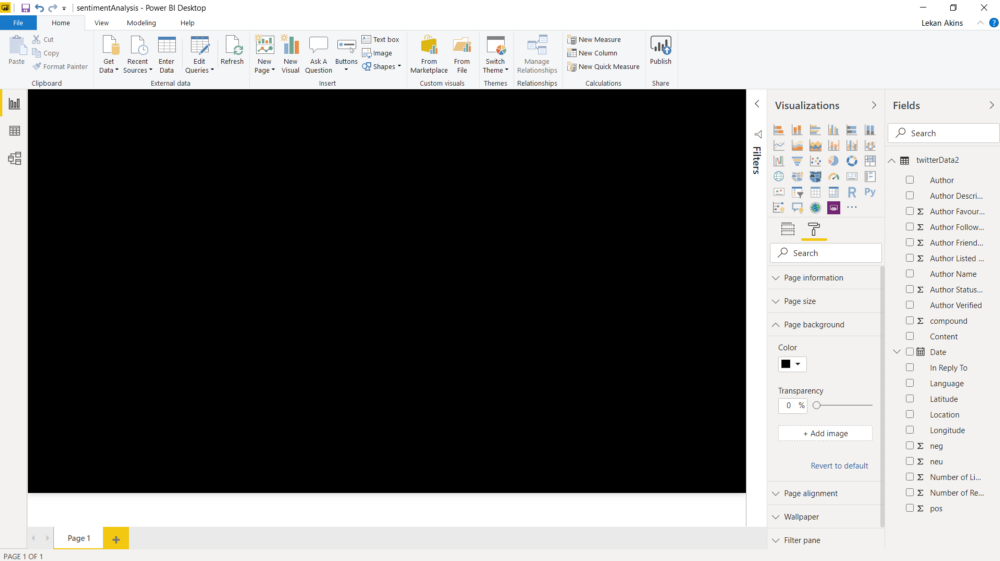
Step 4: Building the Dashboard
Now that we have our data cleaned, let’s go ahead and build the dashboard.
Follow these steps to build the dashboard:
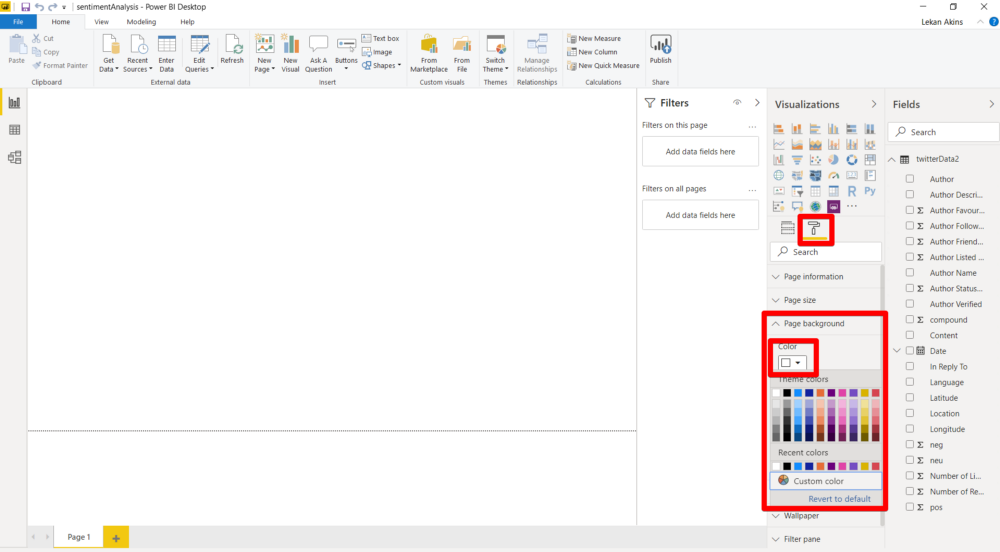
Change the dashboard background: see snapshot below and follow the steps below:
Formating the background
1a. On the Visualisation pane, select the format icon
1b. Select the Page background, click the Color and select a black color. Turn color transparency to 0%. The background is now black as shown in the snapshot below:
the black background
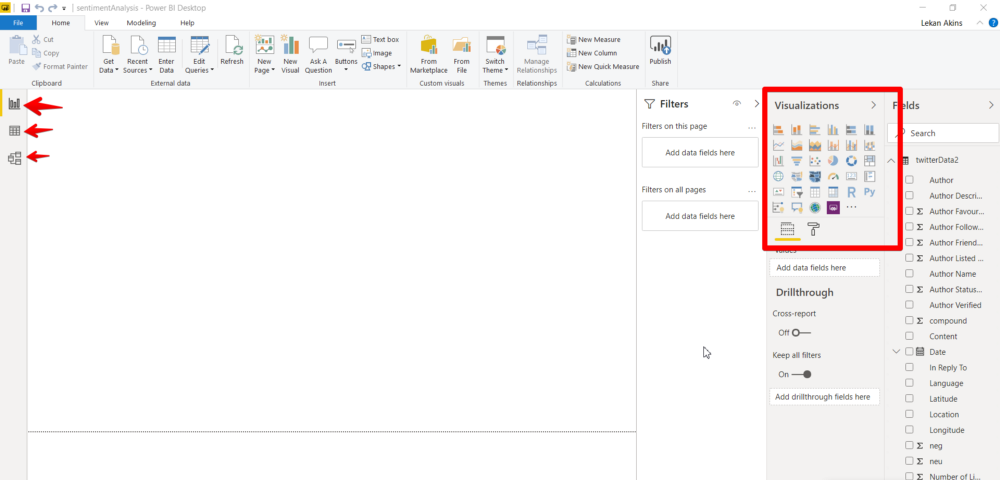
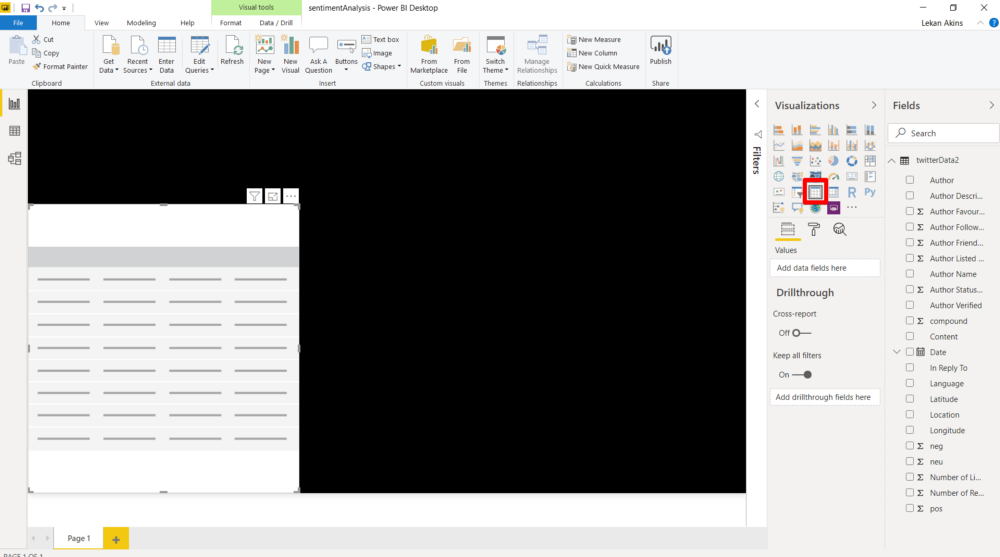
2. Visual 1- Table: To import a visual from the visualization pane to the report space, click the visual and you’ll see it on the report space. We will start by bringing the Table visual to the report space.
Now that you have a Table in the Report space, do the following:
a. On the Data Fields, drag the date column to the value field of the table as shown in the screenshot below
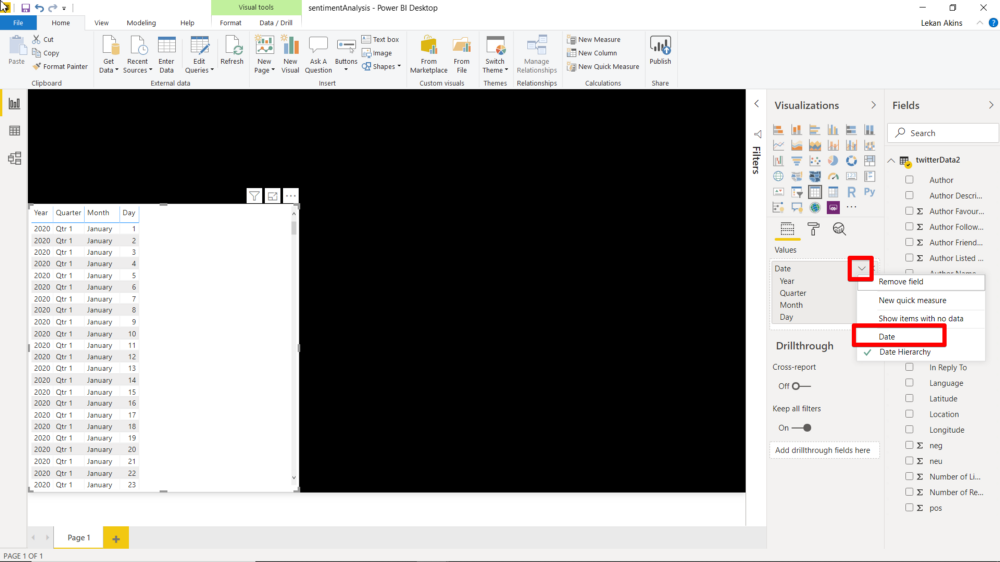
We date is being displayed hierarchically; this is not what we want. So, let’s change the Date from hierarchy to normal date as shown in the screenshot below:
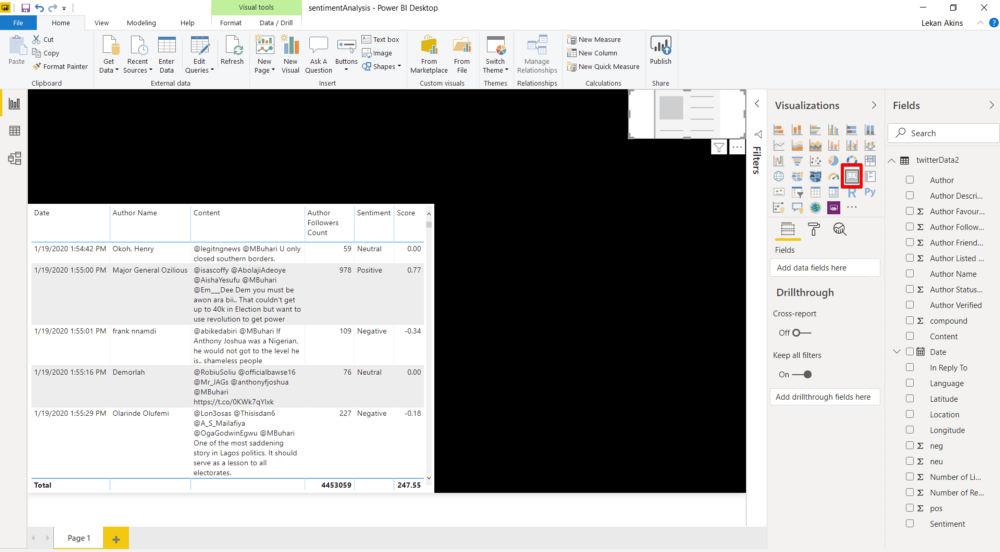
b. Drag the ‘Author Name’, ‘Content’, ‘Sentiment’, ‘Author Follower Count’ and the ‘Compound’ columns to the Value Field of the Visual. Rename ‘Compound’ as ‘Score’ by double-clicking it on the Value pane
Visual 2- Card: To avoid your current visual being changed by the new visual, click on the background of your report before selecting the Card visual. On the Visualisation pane, click the Card visual as shown in the screenshot below:
Now that you have the Card in the Report space, drag content into the Visual field. By default, the Card will show the First Sentence, change this by clicking the drop-down arrow on the visual and select ‘count’ as shown below:
Remember, you can rename a field name by double-clicking the name on the value field and rename it.
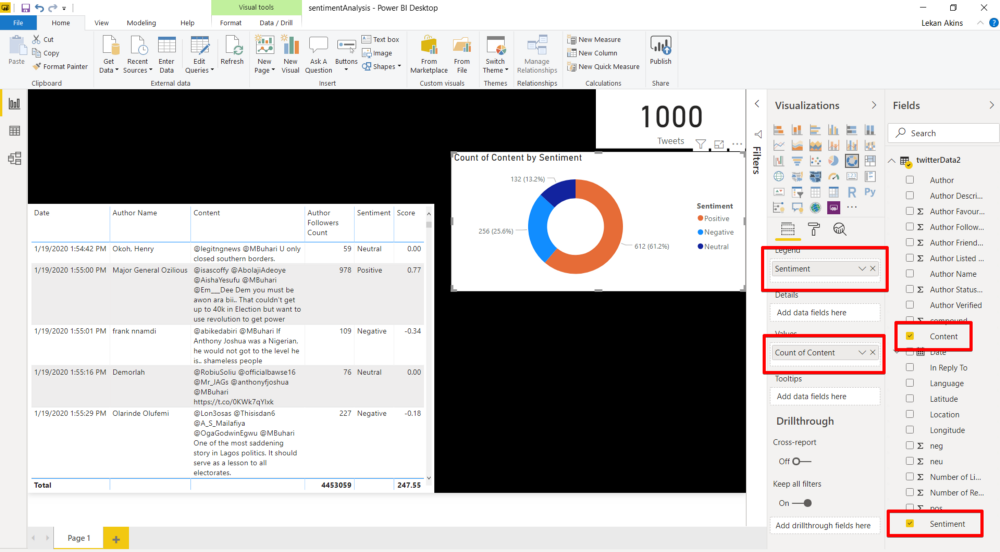
Visual 3- Donut: To avoid your current visual being changed by the new visual, click on the background of your report before selecting the Donut visual. Drag the ‘Sentiment’ field to the ‘legend’ and the ‘Content’ field to the ‘Value’ as shown in the screenshot below.
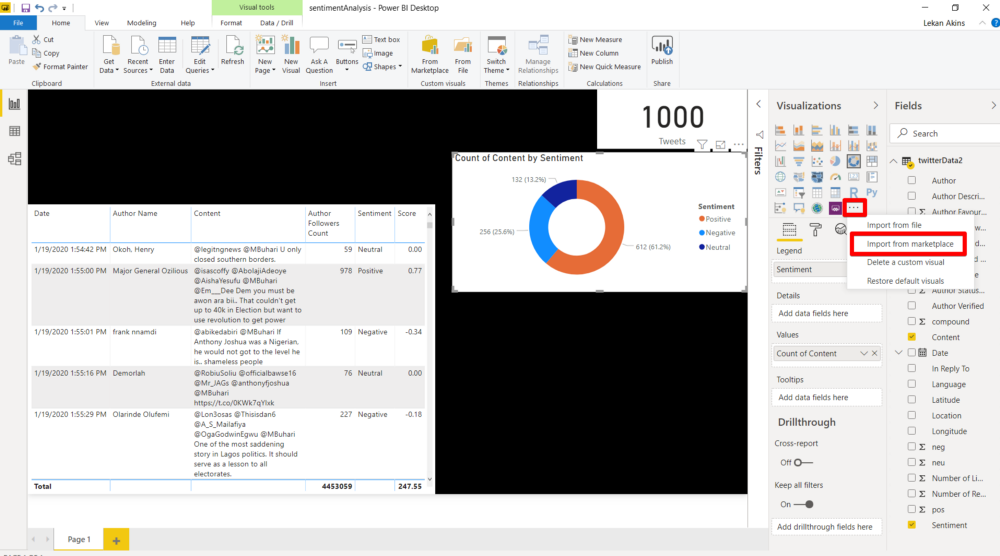
Visual 4- Word Cloud: Word cloud does is not among the default visualization in PowerBi, so we will have to import it as a custom visual from the PowerBi Marketplace. To import a visual from the marketplace, click the ellipse (…) and select ‘import from marketplace’ as shown in the visual below:
Note: you must be signed in to powerbi to import visual from the marketplace.
Search for ‘Word Cloud’ in the marketplace and click ‘Add’ to import the custom visual into your visualization pane as shown below:
Now that you have imported the visual from the marketplace, click the visual to add it to your Report space. Drag the content field to the category of the visual as shown in the image below:
Visual 5- Text Filter: Repeat the same process we used to import the Word Cloud visual from the marketplace to import the Text Filter. Click the Text Filter visual to add it to the report space. Drag the ‘Content’ data field into the visual field as shown below:
Visual 6- Text Box: On the ‘Home’ ribbon, click the text box icon and type, ‘Twitter sentiment Analysis’ into it as shown in the visual below:
Now you have a ready to go PowerBi Dashboard, you can choose to format this dashboard as you desire. You can read more on how to format powerbi visuals here. Finally, let’s publish our dashboard to the web so that anyone on the internet can interact with it.
Publishing to the Web
You need to have a powerbi service account to publish your dashboard.
A PowerBi Dashboard becomes interesting when you can share your beautiful dashboard. To make your dashboard available on the web, follow these steps:
Publish: Click the ‘Publish’ button to push the dashboard to your powerbi service account.
Once the dashboard is published, log in to your powerbi service account here
Your newly published dashboard can be found under the ‘Report’ segment of your ‘My Workspace’. Click the dashboard to view on the web.
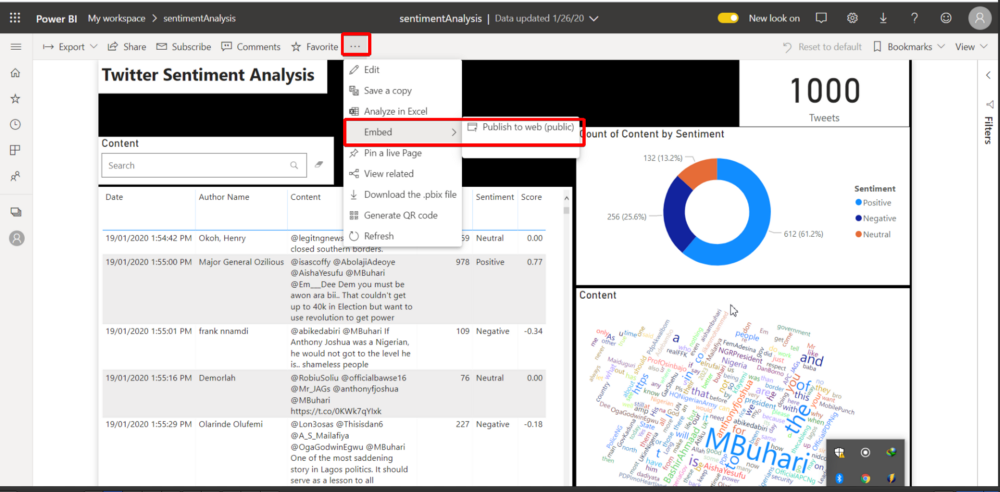
To create an embedded link, you need to publish to the public web as shown in the screenshot below:
5. Publish the dashboard and a link will be generated for you as shown below:
Final Words
Congratulations on making it to the end of this article. Our dashboard is available for view here https://bit.ly/sentimentLekan. Feel free to interact with it.
Natural Language Processing (NLP) is at the core of research in data science these days and one of the most common applications of NLP is sentiment analysis. Also known as “Opinion Mining” or “Emotion AI” Sentiment Analysis is the process of determining whether a piece of writing is positive, negative or neutral.
From opinion polls to creating marketing and public policy strategies, sentiment analysis has completely reshaped the way businesses and governance work, which is why it is an area everyone(both techies and non-techies) must be familiar with.
In this article, we will learn how to carry out Sentiment Analysis on twitter data by using Orange3 Text Mining, Vader and Microsoft PowerBi. Orange3 will be used to stream tweets from Twitter, Vader will be used for the sentiment Analysis and PowerBi will be used to create a sentiment analysis dashboard. Beyond twitter data, the knowledge gained from this tutorial can be used for sentiment analysis on any text data(surveys, polls,etc.)
There can be two approaches to sentiment analysis.
1. Lexicon-based methods
2. Machine Learning-based methods.
We will be using VADER (Valence Aware Dictionary and sEntiment Reasoner) a lexicon and rule-based sentiment analysis tool that is specifically attuned to sentiments expressed in social media.
Let’s build the solution now!
Step 1: Getting the Twitter API Credential
To access the developer account, you need to have a twitter account. In order to access the Twitter API, you need to register an application at http://apps.twitter.com. On the top-right corner, click on the Apps button, Create an App, Apply and then Continue. Next, we will choose the “I am requesting access for my own personal use” option:
On the same web page, scroll down a bit and input your Account name and Country of operation then click Continue, and you will be redirected to the next web page. Here, you can choose any Use Cases you’re interested in. For our case, I chose the following:
After you make your choice, scroll down and fill out the use case interest paragraph required. This tutorial is for learning, so make sure you emphasize on the application being a self-learning/academic-related project. Choose “No” for the government involvement question, and press “Continue”. On the next web page, read the Terms and Conditions list, agree to them then Submit Application. Now, you have to wait for Twitter to verify your developer account.
When you get the approval email, click on the login link it contains. You will be redirected to the following web page, where you should choose “Create an app”.
On the next web page, click “Create an app” from the top-right corner. After you are redirected, fill out the required app details, including — if you’d like — that it is for self-learning purposes. Click “Create”.
The next web page will include the app details that you just input, access tokens and permissions. Proceed to the “Keys and tokens” tab. Copy the API key as well as the API secret key into a safe place (a text file, if you’d like), as we will be using them in a bit. We’re done with the credential acquisition part!
Step 2: Download and Install Orange3 Text Mining
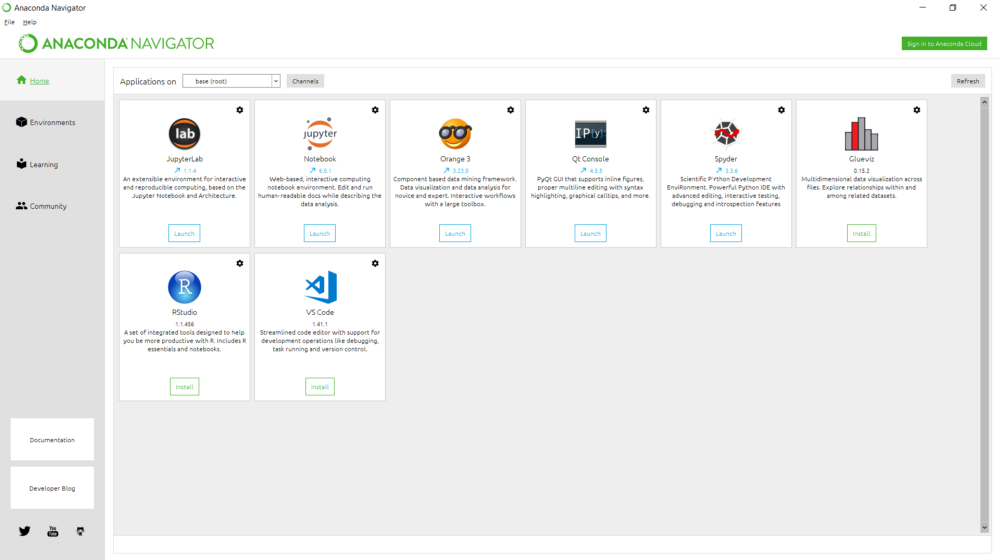
If you already have Anaconda installed on your computer, you can install orange3 from the Anaconda Navigator.
Now that you have Orange3 downloaded, go ahead and install it.
Step 3: Orange3 + Vader for Twitter Streaming and Sentiment Analysis
Now that you have installed Orange3, open the application:
This is the welcome page for Orange3
Click “New” to launch a blank canvas. Orange3 offers a lot of analytics capabilities for data preprocessing, visualization, statistical modelling, and machine learning. You can watch more tutorial videos on their YouTube channel via the link: https://www.youtube.com/channel/UClKKWBe2SCAEyv7ZNGhIe4g/videos
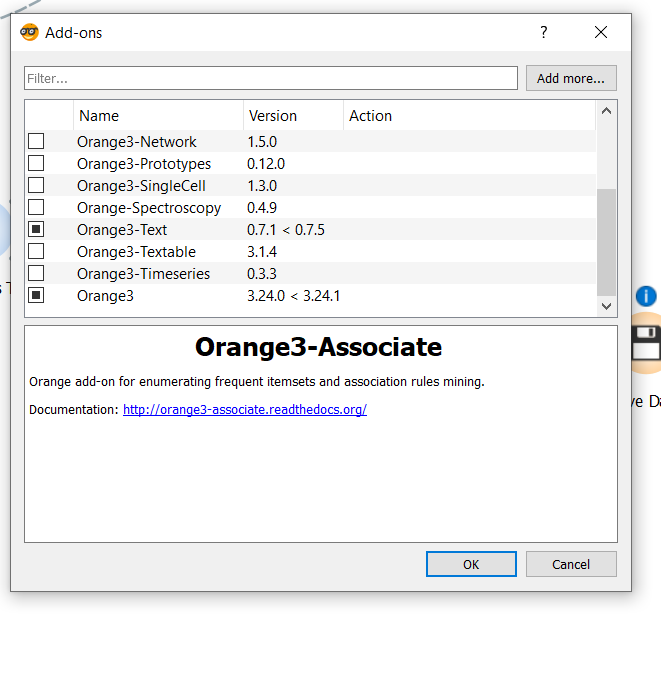
Text Analysis doesn’t come with Orange3 by default, so we need to install the Orange-Text addon. To install, click “Options” on the home ribbon and select “Add-ons…”. Check the Orange3-Text and click okay; wait for the add-on to install.
Orange3 Add-ons window
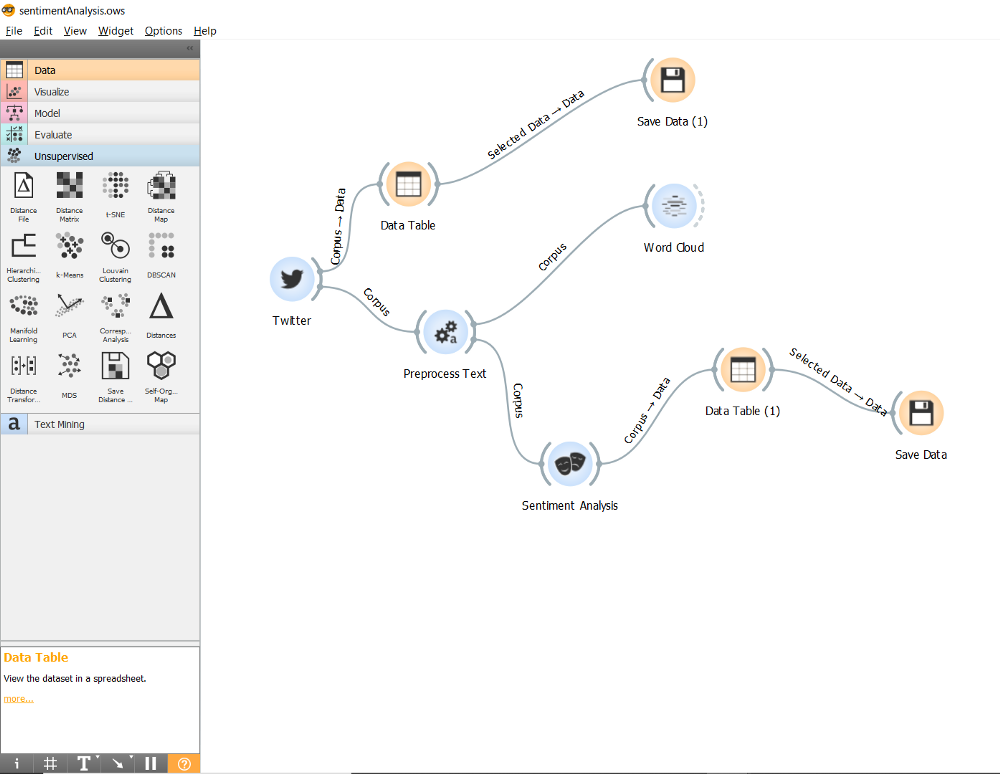
Now that you have the Text add-on installed, let’s build the flow!
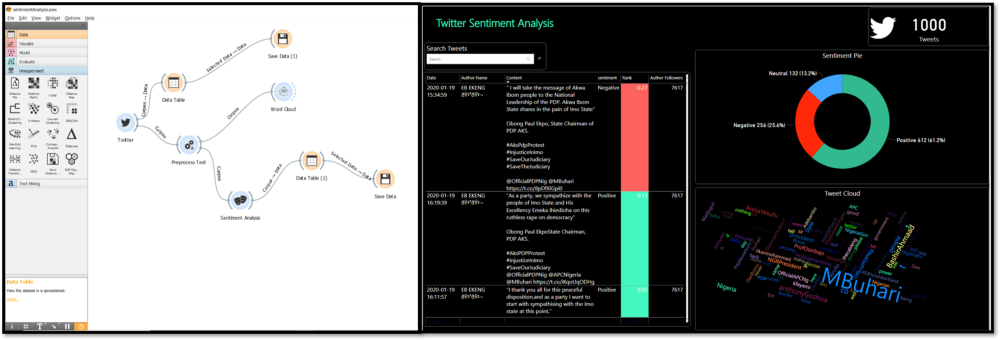
This is the flow that we will build
Follow these steps to build the Orange3 sentiment analysis flow:
The Twitter Widget: Expand the Text Mining drop down on the left panel; drag and drop the ‘Twitter’ widget to the canvas.
The Data Table: Expand the Data drop-down on the left panel; drag and drop the ‘Data Table’ widget to the canvas. Connect the ‘Twitter’ widget to the ‘Data Table’ by dragging any part of the dotted arc of the ‘Twitter’ widget to the ‘Data Table’ widget. NB: This is how you create connections between widgets.
The Save Data: Expand the Data drop-down on the left panel; drag and drop the ‘Save Data’ widget to the canvas. Connect the ‘Data Table’ widget to the ‘Save Data’.
The Preprocess Text: Expand the Text Mining drop down on the left panel; drag and drop the ‘Preprocess Text’ widget to the canvas. Connect the ‘Twitter’ widget to it.
The Word Cloud: Expand the Text Mining drop down on the left panel; drag and drop the ‘Word Cloud’ widget to the canvas. Connect the ‘Preprocess Text’ widget to it.
The Sentiment Analysis: Expand the Text Mining drop down on the left panel; drag and drop the ‘Sentiment Analysis’ widget to the canvas. Connect the ‘Preprocess Text’ widget to it.
Now that you have successfully set up your workflow, let’s discuss how we would work with each of these widgets to create our sentiment analyzer.
The Twitter Widget
Double click the ‘Twitter’ widget and the configuration window opens up:
Configuring the Twitter Widget
Click the ‘Twitter API Key’ button and input you ‘Consumer API Key’ and ‘Secret Key’ that was generated in Step 1
For this tutorial, we will stream 1000 tweets where the word mbuhari(the official twitter handle of the Nigerian President, President Muhammadu Buhari GCFR) was mentioned. So, if you would like to follow this article religiously, input ‘mbuhari’ in the query word list box and set the max tweets to 1000. Click ‘Start’ to start streaming data from twitter. (tweets streamed on January 19th, 2020)
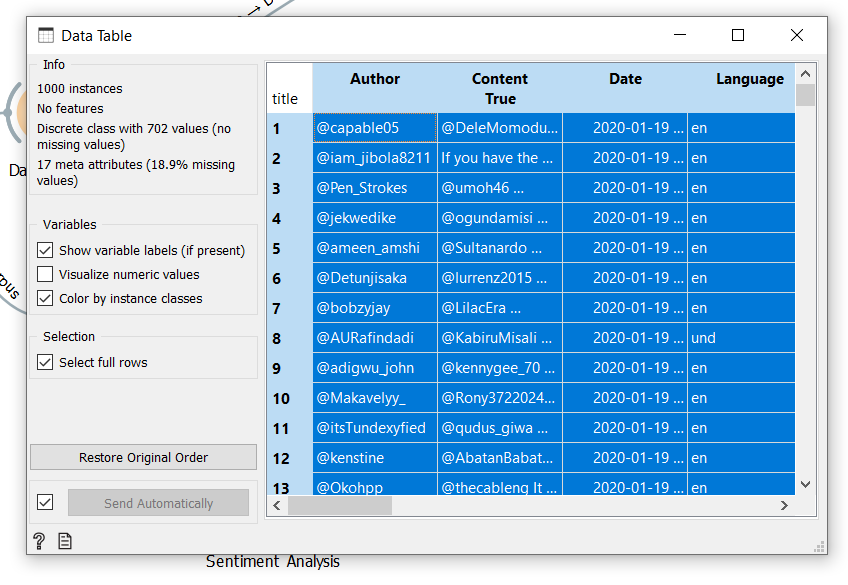
The Data Table Widget
In this workflow, we made use of two ‘Data Table’ widgets. This widget allows us to view the data in a table format. The first data table is connected to the ‘Twitter’ widget. We can view this data by double-clicking the ‘Data Table’ widget.
The Save Data Widget
This widget saves data from the data table as .csv. Double click this widget to define the name and path for your file.
Note: ‘Save Data’ will only save the highlighted data on the ‘Data Table’. So, to highlight data on the data table, double click the ‘Data Table’ widget to open the ‘Data Table’ Window. Double click the ‘title’ on the top left corner of the table, the entire data table is highlighted and automatically saved to .csv
Highlighted data table will be saved
The Pre-process Text Widget
This constructs a text pre-processing pipeline. It allows us to transform, tokenize and filter our data. Double click the widget to open the Preprocess window. We want to transform our data by maintaining lower case in all tweets, removing accents, parse HTML and removing URLs; so, please check all the boxes under the Transformation section.
Under Tokenization, we are only interested in splitting by regular expressions and keeping only words. Select Regexp and type \w+ as the pattern.
Under Filtering, we will remove stop words in the English language. So, check ‘Stopwords’ and set language to ‘English’
Preprocess Text window
The Word Cloud
This widget is one of my favorite text analytics visuals. It helps you see the most mentioned words in text data. See what our cloud looks like:
The Sentiment Analysis
Double click this widget and select Vader. VADER uses a combination of a list of lexical features (e.g., words) which are generally labeled according to their semantic orientation as either positive or negative. VADER not only tells about the Positivity and Negativity score but also tells us about how positive or negative a sentiment is.
Next Part
The ‘Data Table’ that connects to the ‘Sentiment Analysis’ widget contains the tweets and the sentiment score. This is the data that we are interested in; it will serve as a database for our interactive dashboard. In the next part of this tutorial, we will explore how to create a fully functional sentiment analysis dashboard with PowerBi.
See you then!
I hope you found this tutorial interesting. Please share and remember to clap.
Saturday Professional Business Analytics Training new cohort classes
January 12
Kick off of NLP, Geospatial and Health Data workstream at AI Hub
January 17
Train-the-Teachers Artificial Intelligence Masterclass and book distribution in Owerri, Imo State.
January 20
Kick-off of AI+ Clubs in secondary schools as an after-school club in Lagos secondary schools
January 25
The SeqHub/Maxng/DSN Ideathon – AI Hub
February
February 5 - March 11
Beginners AI Wednesdays 6-week intensive introduction to Python and Machine Learning
February 6 - March 12
Pre-University Training in 5 states on Introduction to Python and Machine Learning
February 10
Association for the Advancement of Artificial Intelligence Conference - AI for Social Impact
February 15 - April 30
Kaggle competition
TBD
Retina-AI AI DevOps Hackathon
February 27
Train-the-Teachers Artificial Intelligence Masterclass and book distribution
February 26
1-day Masterclass in R programming
March
TBD
AI Invasion in 50 cities (1-week intensive introduction to Python/Machine Learning in 50 cities in Nigeria)
March 21 – Jun 13
Weekend Certification classes in BigML, Columbia/Edx and Microsoft Azure
TBD
Data Science for Marketing: 3-day intensive corporate training
TBD
Train-the-Teachers Artificial Intelligence Masterclass and book distribution
March 28
AI+ Dial-in Masterclass: Reinforcement Learning
April
April 3
AI for Financial Inclusion workshop
TBD
Readiness Kaggle/Zindi Mini-competition - Best participants win books and tickets to tech events
April 24
1-day Masterclass in Natural Language Processing
April 29-30
AI Researchers Conference – International conference hosted in Lagos
April 29-30
Participation at ICLR Ethiopia [Virtual Conference]
May
May 4-8
AI for Good Global Summit 2020, Geneva, Switzerland : Attendance and showcase
May 15
1-day Masterclass in Data Engineering
May 16
Data Visualization with Microsoft PowerBI Masterclass : 5 Saturdays intensive corporate training
TBD
Beginners AI Wednesdays 6-week intensive introduction to Python and Machine Learning
TBD
Pre-University Training 6-week class on Introduction to Python and Machine Learning
TBD
Data Science for Human Resources/People Analytics : 3-day intensive corporate training
May 21-22
PhD Research Paper writing workshop with Dr Elaine Nsoesie [Virtual Training]
May 28
Fall in Love with AI – Women meet up on AI Career development
TBD
IndabaXNigeria
June
June 12
Machine Learning Masterclass in collaboration with Google
June 13
AI+ City and Campus Ambassadors Conference in Lagos
June 25 – August 24
Pre-Bootcamp 60 days of Machine Learning and Deep Learning
June 30
Release of whitepaper on AI-powered Citizen Science on Digital Marketing/Social Media
TBD
1-day Masterclass in Microsoft Azure DevOps
TBD
Deep Learning Masterclass : Intensive virtual corporate training
July
TBD
AI+ for Professionals Meet-up
TBD
Data Science for Banking/Fintech/Insurance : 3-day intensive corporate training
TBD
Robotic Process Automation Masterclass: 2 Saturdays intensive corporate training
TBD
Data Science for Technical professionals: 3-day intensive corporate training
August
TBD
Business/Data Analytics for Professionals: 2 Saturdays intensive corporate training
TBD
Masterclass on AI for Project Monitoring and Evaluation for non-profit
TBD
Data Engineering: 2 Saturdays intensive corporate training
TBD
AI Summer School for Grades 5-9
TBD
Artificial Intelligence and Financial Inclusion Research meet-up
TBD
Ladies in AI Meet-up
TBD
Deep Learning Indaba Tunisia – participation and poster showcase
September
TBD
AI Bootcamp 2020 Selection Kaggle/Zindi Competition
TBD
Data Analytics with Microsoft Azure and BigML : 2 Saturdays intensive corporate training
September 25
September 26
AI Bootcamp 2020: Call for posters
TBD
Game theory and Mechanism design Masterclass : 2 Saturdays intensive corporate training
October
October 1
Release of our AI Blueprint for Nation Building – 60 Imperatives for AINaija as part of Nigeria’s 60 th Independence anniversary
October 20
AI Summit 2020: AI for 21 st century Governance and Business Success
October 22
AI Masterclass for Executives and Business Leaders
October 20 - 25
AI Bootcamp – 4 streams sessions (Beginners, Intermediate, Advanced Researchers and Professional streams) – an intensive fully residential and all-expense paid for best 250 best students, researchers and young professionals.
November
November 2
Release of DSN whitepaper on AI-powered Citizen Science on Natural Language Processing and Health using Twitter Data
TBD
Beginners AI Wednesdays 6-week intensive introduction to Python and Machine Learning
TBD
Pre-University Training 6-week class on Introduction to Python and Machine Learning
TBD
Deep Learning Masterclass - CNN
TBD
Deep Learning Masterclass - RNN
December
December 2 - 8 (TBD)
NeurIPS 2020 Vancouver, Canada - attendance and poster showcase
December 7 - 8
Local NeurIPS meet-up at AI Hub, Yaba
December 18 - 20
Data Science Nigeria team annual strategy retreat/team building
December 23
AI Hub Team End-of-year party/Business closes for the year
We have had a very awesome 2019. We have activated our vision to raise one million Artificial Intelligent talents in 10 years. We have scaled up sustainability and built unique platforms to support our operation and expansion.
We are indeed very grateful to our inspiring staff, awesome sponsors, amazing advisory board members, supportive partners, and the ever-energetic community members.
Of a truth, we are well-positioned to achieve our mission to build a world-class Artificial Intelligence (AI) knowledge, research and innovation ecosystem that delivers high-impact transformational research, business use applications, AI-first start-ups, support employability, and social good use cases in Nigeria and beyond.
Lagos NeurIPs Meetup Programme Schedule Venue: AI Hub, 174b Murtala Muhammed Way, Yaba (4th floor Sunu Assurance Building)
Friday 13th of December, 2019
4:00 – 4:15: Welcome & Data Science Nigeria Introduction
4:15 – 4:30: NeurIPS introduction
4:30 – 5:00: Living is an Agricultural Act: AI for Global Food Security by Sarah Menker
5:00 – 5:30: Discussion on Data Science Nigeria AI class monitor
5:30 – 6:25: Veridical Data Science by Bin Yu
6:25 – 7:15: Social Intelligence by Blaise Aguera y Arcas
7:15 – 7:30: Book Winning Time
7:30 Menu: Finger food and drink
Saturday 14th of December 2019
10:00 – 10:15: Welcome
10:15 – 10:50: Machine Learning Meets Single-Cell Biology: Insights and Challenges by Dana Pe’er
10:50 – 11:40: How to Know by Celeste Kidd
11:40 – 12:10: Discussion on Data Science Nigeria AI class monitor
12:10 – 12:50: From System 1 Deep Learning to System 2 Deep Learning by Yoshua Bengio
12:50 – 1:30: Women in Machine Learning (WiML) Affinity Workshop 2
1:30 – 1:45: Book Winning Time
1:45 Menu : Finger food and drink
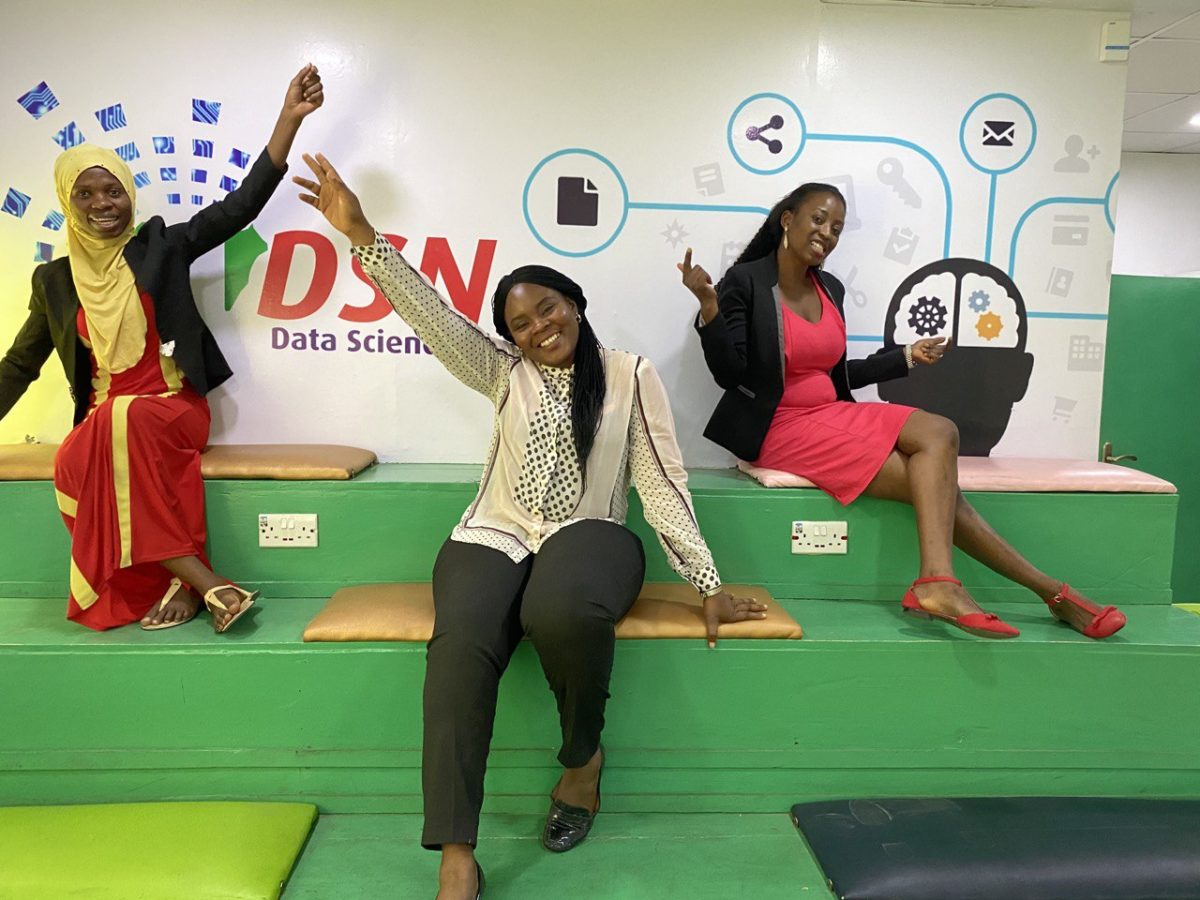
As a part of Data Science Nigeria’s transition from an Artificial Intelligence learning community into a research and consulting non-profit, the business is expanding its dedicated workforce with the recruitment of three new data scientists. The new, young and energetic data scientists will be working on a special project at the interception of advanced analytics, statistical model development, data visualization and platform development for real-time analytics.
Join us to welcome 3 awesome ladies into our Data Science core team.
Meet the new team members Sarah Opeyemi Adekunle, Data Scientist:
A Masters’s graduate of Systems Engineering. She is a product of the Microsoft4afrika where she groomed her skills in Data Science and Business Intelligence. She has built industry-level experience in Data Analysis, and Machine Learning use cases. She was the second-best female participant (4th position) at the 2017 Data Science Nigeria Artificial Intelligence Bootcamp.
Chimaoge Esotu, Data Scientist:
A passionate data scientist with a passion for trends mining. She has built competencies in skilled statistical analysis, machine learning and various types of database management. She has had industry level experience as a data analyst and business performance reporting expert. Chimaoge has hands-on experience in many visualizations, analytical and mathematical programming tools.
Haleemah Oladosu, Data Scientist:
A multi-skilled professional who combines her machine learning skills with software engineering and IT support Administration. An ex-Andela software engineer and a Kaggle participant per excellence with 9 competitions in her kitty. She was in the Top 2% in the Women in Data Science (WiDS) Datathon 2019. She had a Master’s degree in Artificial Intelligence/Data Mining.